Sebastian Knust¹, Andy Sischka¹, Andre Spiering¹, and Dario Anselmetti¹
¹: Experimental Biophysics & Applied Nanoscience, Faculty of Physics, Bielefeld University, 33615 Bielefeld, Germany
Abstract
For measuring the minute forces exerted on single molecules during controlled translocation through nanopores with sub-piconewton precision, we have developed a video-based axial force detection and analysis system for optical tweezers [1].
As the bandwidth of the system is not as high as in backscattered light based systems, we integrated Allan variance analysis [2] for trap stiffness calibration.
Upon manipulating a microbead in the vicinity of a weakly reflecting surface with simultaneous axial force detection, interference effects have to be considered [3]. We measured and analyzed the backscattering light properties of polystyrene and silica microbeads with different diameters and propose distinct and optimized experimental configurations (microbead material and diameter) for minimal light backscattering and virtually interference-free microbead position detection.
As a proof of principle, we investigated the nanopore threading forces of a single dsDNA strand attached to a microbead with an overall force resolution of ±0.5 pN at a sample rate of 123 Hz.
Theory
Optical tweezers generate a three dimensional harmonic potential. Applying an axial force at an optically trapped microbead deflects the bead and thereby defocuses it. This can be used to measure the applied force, either by analyzing the intensity of the transmitted or reflected trapping light, or by monitoring the apparent size of the bead.
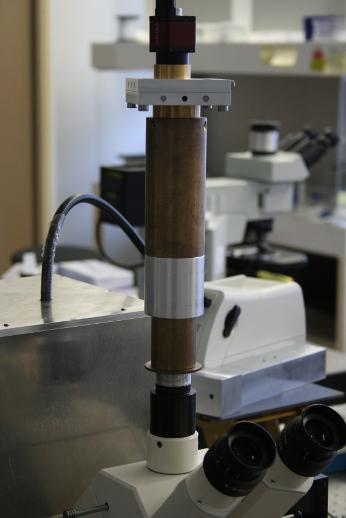
Experimental Setup

For illumination, we use a Schott KL2500 LED cold light source with a maximum output of 1000 lm.
A custom built post-magnification with a magnifying factor of 10 and an AVT Guppy Pro F-031 monochrome firewire CCD camera with 14-bit image acquisition at 123 fps are utilized for image acquisition.
With the pixel size of 5.6 µm, we get a conversion factor of approximately 9 nm/px. Thus, a 3.05 µm bead has an apparent radius in the range of 170px.
A 1 pN force corresponds to a bead radius change of approximately 0.8 px at 250 mW laser power.
Size Detection

We manually select circular regions of interest for rising (green) and falling (red) edges. The strongest rising and falling edges (green and red points) are detected along radial spokes (blue). The orange dots are the resulting mid-points between the two edges, through which the yellow circle is fitted.
For clarity, only every tenth spoke with corresponding edges is shown.
Bead size and interference
 When working in the vicinity of surfaces, even weak reflections lead to unwanted interference effects. Some beads however reflect only a small fraction of light. They therefore exhibit only negligible interference, however backscattering is limited as well. Only video-based force analysis is capable of measuring low-noise interference-free signals.
Force calibration
 Allan variance (AV) allows for easy calibration of low frequency signals. It is defined as half the variance of the averaged difference between two consecutive local averaged position samples:
\[\]
The AV of a trapped bead, which is a damped harmonic oscillator, can be analytically expressed [2] as
\[\]
Controlled dsDNA threading through 55nm NP

Conclusion
Our current setup delivers interference-free axial force detection with a resolution of ±0.5 pN at a sample rate of 123 Hz. Lateral force detection can be easily implemented as well.
References
[1] S. Knust et. al., Rev. Sci. Instrum. 83, 103704 (2012)
[2] B. Lansdorp, O. Saleh, Rev. Sci. Instrum. 83, 025115 (2012)
[3] A. Sischka et. al., Rev. Sci. Instrum. 79, 63702 (2008)